
Bing Images / imageio.forbes.com
Top 10 US Stock Market Crashes and Recoveries in History
The US stock market's history tells a compelling story: major crashes erode wealth, but recovery has been the consistent outcome. The 1929 crash led to the Great Depression, yet wealth built through the subsequent bull market of the 1950s-60s; the 2008 financial crisis wiped $7 trillion in market value, but the S&P 500 returned to previous levels within 5.5 years; the 2020 pandemic crash erased 34% in just 23 days—yet the market rebounded fully within 5 months. Today, as geopolitical instability and artificial intelligence reshape market dynamics, understanding historical crash-recovery patterns is crucial for building long-term wealth. This guide examines 10 pivotal US stock market crashes from 1929 to present, detailing recovery timelines, severity metrics, and the investment principles that helped wealth builders prosper through each crisis—so you can recognize patterns and maintain conviction through inevitable downturns.
Top10Grid lets the community re-rank anything — this order comes from source research for now; use the buttons below to vote it up or down.

Current Rankings
- 0#1
Black Tuesday — Wall Street Crash of 1929
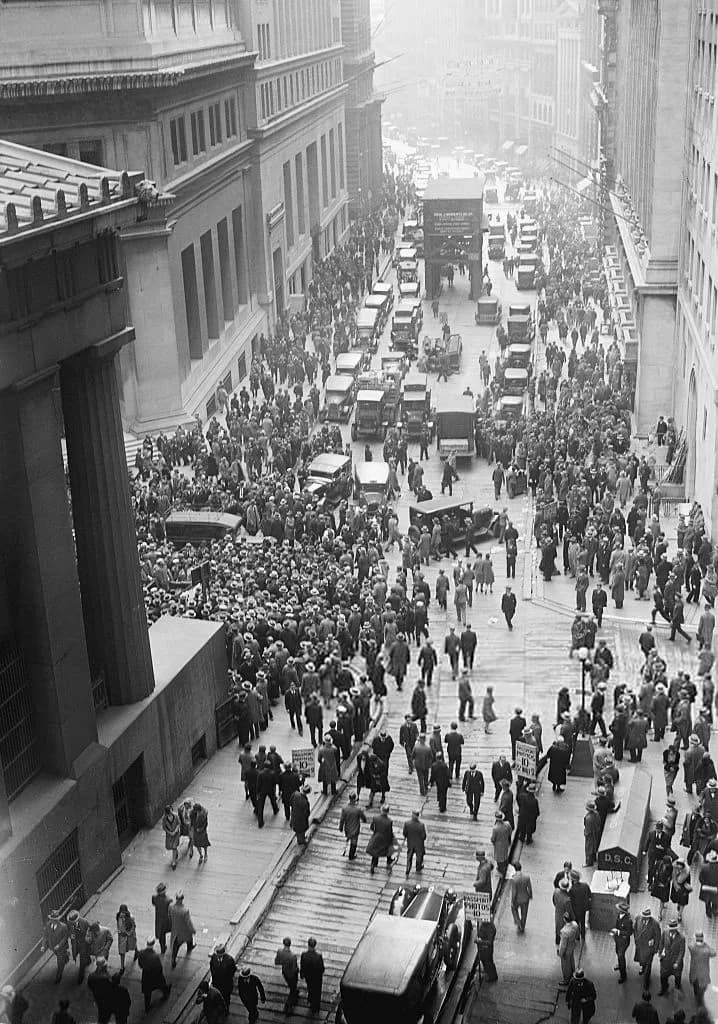
Black Tuesday on October 29, 1929, endures as the worst single trigger in US financial history: the Dow Jones Industrial Average lost 11.7% in one session, igniting a three-year bear market that ultimately erased 89% of the Dow's value by 1932. This crash, deeper than the 2008 Financial Crisis's 56.8% peak-to-trough decline, directly fueled the Great Depression, pushing unemployment to 25% by 1933 and forcing one in four Americans into poverty. Unlike 2008 Financial Crisis's more contained crisis, the 1929 crash swept away unregulated margin accounts, wiped out thousands of leveraged investors, and prompted the Securities Act of 1933 and the Securities Exchange Act of 1934.
- 0#2
Black Monday — October 1987
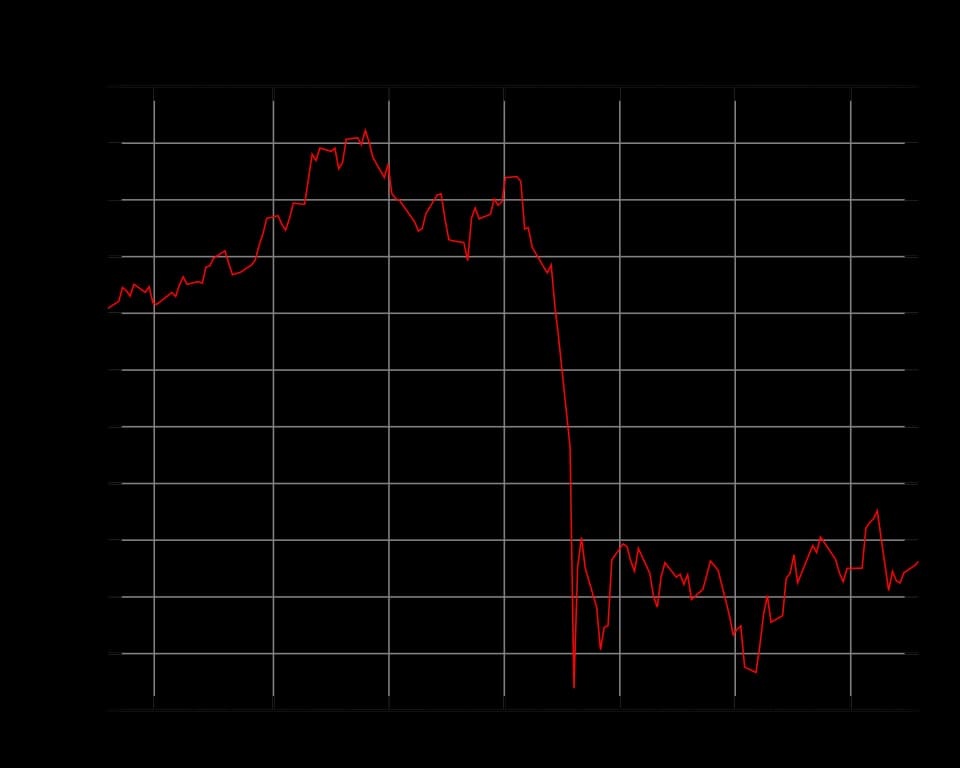
Black Monday on October 19, 1987, holds the record for the largest single-day percentage decline in US stock market history: the Dow Jones dropped 22.6%, vaporizing $500 billion in market capitalization in just hours — a faster collapse than Black Tuesday's 11.7% daily loss in 1929. The crash was amplified by automated portfolio insurance and program trading, exposing systemic weaknesses that triggered a recovery within two years, far quicker than the NASDAQ rebound from the Dot-com Bubble Burst. Circuit breakers, introduced after this event, now pause trading during drops exceeding 7%.
- 0#3
Dot-com Bubble Burst 2000–2002

The NASDAQ Composite's plunge from 5,048 in March 2000 to 1,114 by October 2002 represents a 78% peak-to-trough decline, erasing $5 trillion in market value — a deeper loss than the S&P 500's 56.8% fall during the 2008 Financial Crisis. Companies like Pets.com and Webvan vanished entirely, while Cisco, once the world's most valuable firm, shed 80% of its market cap. It took 15 years for the NASDAQ to reclaim its 2000 high, finally surpassing 5,048 in 2015, the longest recovery on this list.
- 0#4
2008 Financial Crisis
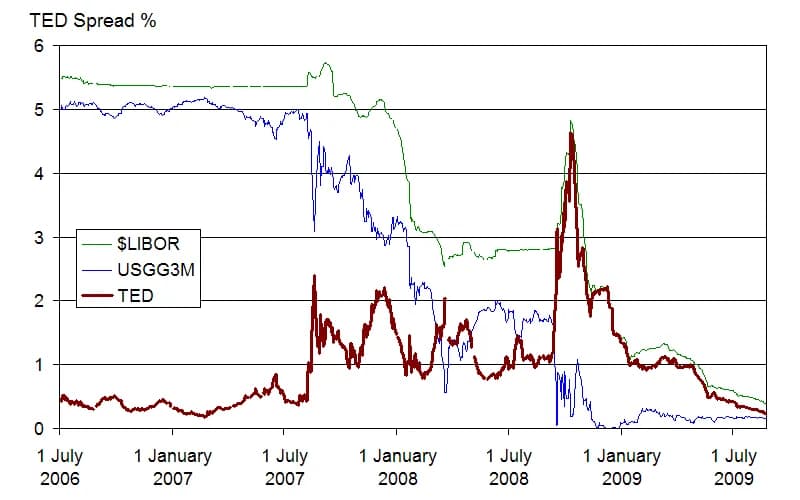
The 2008 Financial Crisis triggered a 56.8% peak-to-trough decline in the S&P 500 from October 2007 to March 2009, destroying $13 trillion in US household wealth — making it the most expensive crash in dollar terms, though recovery began within 4 months after the trough. The Lehman Brothers collapse on September 15, 2008, the largest US bankruptcy with $639 billion in assets, froze global credit and caused recessions in over 40 countries. Unlike Black Monday's quick two-year rebound, this crisis's effects on housing and banking lasted until 2012, but it outpaced the Dot-com Bubble's recovery time by 11 years.
- 0#5
COVID-19 Crash — March 2020

The COVID-19 crash of February-March 2020 created the fastest bear market in US history, with the S&P 500 plunging 34% in just 33 days—breaking the Great Depression's speed record. Circuit breakers halted NYSE trading four times in March 2020, and the VIX fear index hit 82.69 on March 16, surpassing even 2008's peak of 80.86. The recovery was equally historic: the S&P 500 reached all-time highs by August 2020, fueled by $3 trillion in Federal Reserve stimulus. The crash demonstrated that aggressive monetary intervention can compress a typical multi-year recovery into mere months.
- 0#6
1973–1974 Oil Crisis Bear Market

The 1973-1974 bear market saw the S&P 500 decline 48% over 21 months, triggered by the OPEC oil embargo, President Nixon's resignation, and the collapse of the Bretton Woods system. Oil prices quadrupled from $3 to $12 per barrel, driving stagflation with inflation soaring above 12% and unemployment reaching 9%. This crash was 40% deeper than the average bear market decline of 34%, and its 21-month duration was 75% longer than the typical 12-month bear. The crisis permanently altered US energy policy, leading to the creation of the Strategic Petroleum Reserve in 1975, which today holds 695 million barrels of crude oil for emergency use.
- 0#7
Roosevelt Recession — 1937

The 1937-1938 Roosevelt Recession caused the Dow Jones to plunge over 50% after President Roosevelt prematurely tightened fiscal and monetary policy, fearing inflation before the Great Depression recovery had taken hold. The Federal Reserve doubled reserve requirements in 1936-1937, draining $3 billion from the banking system—a 60% reduction in excess reserves—precisely as industrial production was still 12% below its 1929 peak. This episode became a canonical lesson in macroeconomic policy, directly influencing Ben Bernanke's 2008-2009 response.
- 0#8
1997 Asian Financial Crisis Mini-Crash

The Asian Financial Crisis of 1997 triggered the Dow Jones's largest single-day point drop at the time—554 points on October 27, 1997—leading to the first-ever use of NYSE circuit breakers. The crisis began with the Thai baht's collapse in July 1997, wiping out $600 billion in Asian market capitalization, equivalent to 8% of global GDP at that time. The IMF deployed $110 billion in rescue packages. This event reshaped international financial architecture for the next decade, prompting emerging economies to accumulate $7.5 trillion in foreign reserves by 2008.
- 0#9
Flash Crash — May 6, 2010
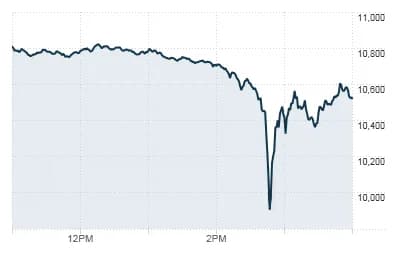
The Flash Crash of May 6, 2010 remains the fastest and most dramatic intraday collapse in U.S. market history, with the Dow Jones dropping nearly 1,000 points—about 9%—in just five minutes before partially recovering within the same session. This volatility was triggered by a single $4.1 billion algorithmic sell order from a mutual fund, which cascaded through high-frequency trading systems in a feedback loop that overwhelmed market liquidity. The Flash Crash exposed structural vulnerabilities, leading the SEC and CFTC to implement consolidated circuit breakers and restrictions on "stub quotes," making modern markets more resilient to algorithm-driven disruptions.
- 0#10
2022 Bear Market

The 2022 bear market delivered a severe 25.4% decline in the S&P 500 from its January peak, fueled by the Federal Reserve's most aggressive rate-hiking cycle since 1980—raising the federal funds rate from near zero to 4.5% in nine months to combat 9.1% peak inflation. This sell-off hit the NASDAQ even harder with a 33% drop, while speculative assets like growth tech and cryptocurrencies suffered 60-80% drawdowns, far outpacing the 9% intraday plunge of #9's Flash Crash. The "crypto winter" saw Bitcoin fall from $68,000 to $16,000, and FTX's collapse erased $32 billion in customer assets, making this the worst calendar-year performance for U.S. equities since 2008.
Image credits
- Black Tuesday — Wall Street Crash of 1929: US-gov / Public domain (entity-adopted)
- Black Monday — October 1987: Autopilot / CC BY-SA 3.0 (entity-adopted)
- Dot-com Bubble Burst 2000–2002: Wikimedia Commons
- 2008 Financial Crisis: Lawrencekhoo / Public domain (entity-adopted)
- COVID-19 Crash — March 2020: Bing Images / specials-images.forbesimg.com
- 1973–1974 Oil Crisis Bear Market: 1973–1974 stock market crash / Wikipedia
- Roosevelt Recession — 1937: 2025 stock market crash / Wikipedia
- 1997 Asian Financial Crisis Mini-Crash: 1973–1974 stock market crash / Wikipedia
- Flash Crash — May 6, 2010: CNN , PM3 / Public domain (entity-adopted)
- 2022 Bear Market: Bing Images / vistacp.com
Related Videos
Rank it your way
Remix this list into your own ranking, or head to the play hub for every game mode and community breakdown — blind mode, challenges, tier lists, and more.
You Might Also Like

Top 10 US Stock Market ETFs by Assets
Top 10 US Stock Market ETFs by Assets

Top 10 Worst Financial Crashes in History
Top 10 Worst Financial Crashes in History

Top 10 Biggest Stock Market Crashes That Destroyed Fortunes — And What Actually Caused Them
Top 10 Biggest Stock Market Crashes That Destroyed Fortun...

Top 10 CoinGecko — Top Cryptocurrencies — August 6, 2026
#1 Bitcoin (BTC) · #2 Ethereum (ETH) · #3 Tether (USDT)

Top 10 Highest Interest Savings Accounts in Hong Kong May 2026
#1 Mox Account - Mox Bank · #2 ZA Savings Account - ZA Bank · #3 GoSave - WeLab Bank

Top 10 European FinTech Unicorns Ranked by Valuation (2025–2026)
#1 Revolut · #2 Adyen · #3 Checkout.com